How to Use Technical Analysis to Trade Currency Crosses in Forex
Unleash the power of precision! Navigate the forex markets with savvy technical analysis for profitable currency cross trading. 🚀📈

Technical analysis has long been employed by forex traders to inform their trading decisions. By analyzing historical price trends and using indicators, such as the moving average convergence divergence (MACD), trendlines, and other patterns in charting, traders aim to identify market direction and possible entry points.
Through technical analysis, a trader can identify currency crosses that they deem viable investments according to what the past data shows. This technique of trading is especially useful when it comes to foreign exchange markets since they often exhibit more volatility than equities and other assets due to their large size.
Contents:
- Technical Indicators
- Price Action Strategies
- Trend Filtering
- Strength Gauging
- Relative Volume
- Support & Resistance
- Momentum Oscillators
- Sentiment Analysis
- The Takeaway
- Discover TradeDork
Trading currency crosses through technical analysis requires a thorough understanding of the key components of these markets: liquidity, timing, correlations between pairs, risk management strategies, different types of orders available for execution and order book mechanics. One must also be aware of news events that may affect the price action or implied volatility in various currencies. A trader with knowledge of these concepts can make sound decisions when attempting to capitalise on opportunities within the volatile nature of forex markets.
Technical Indicators
The use of technical analysis is an important component for trading currency crosses in forex.
Leveraging a range of indicators can help traders identify potential trends and key support or resistance levels, as well as establish the optimum entry and exit points for positions.
Technical indicators are mathematical calculations based on historical price data that display various characteristics of stocks, commodities and currencies. Examples include trendlines, moving averages and oscillators such as MACD and RSI which measure momentum to determine overbought/oversold conditions. These technical indicators often move ahead of pricing action in order to anticipate changes in market sentiment that would affect prices before they occur.
It’s important to note that signals generated from technical indicators must be used within the context of market movement — they should never be applied independently. Technical indicators provide a wealth of insight but there needs to be clear understanding of how those insights work together with price movements in order to make informed decisions when trading currency crosses in forex markets.
Price Action Strategies
Aspiring currency traders should familiarize themselves with price action strategies, an important tool in technical analysis.
This type of strategy involves looking at past prices to assess the current or future direction of a currency pair. By analyzing this historical data, traders can identify key support and resistance levels, which help them make trading decisions.
Price action strategies include trend-following systems, ranging markets and breakouts. Trend-following looks at recent pricing trends to inform buying or selling decisions. Traders buy when they think price is likely to continue trending upwards, and sell if they think it will go down.
Ranging markets allow investors to take advantage of sideways movement by placing buy orders near the bottom of the range and setting sell orders near the top; when one order is fulfilled the trader liquidates their position on the other side for a profit. Breakout trades involve recognizing when prices have moved outside previously established boundaries and taking positions based on whether prices are expected to move up or down from thereon out.
Traders must also be mindful of news events that could cause rapid fluctuations in currency value, such as central bank policy announcements or election results that may impact market sentiment. It’s important not only to stay informed about relevant economic indicators but also how these correlate with chart patterns so you can determine which may be most beneficial in a given situation.
Trend Filtering
Using trend filtering as a technique of technical analysis in forex trading can be an effective way to identify attractive buy and sell points.
By utilizing moving averages, trendlines, and other momentum indicators, traders can define the direction of price movements over short-term or long-term periods and assess risk/reward scenarios related to different currency pairs. Trend filters allow investors to assess which pair is most likely to benefit from changes in market conditions by providing comprehensive tools that detect shifts in sentiment and expected returns.
Traders may choose to enter trades if they believe that positive trends will continue while exiting if signs indicate potential reversals. Technical traders use trend filters along with statistical methods such as candlesticks patterns in order to measure potential entry points for their strategies. In this regard, these indicators are invaluable for helping gauge how markets might react to future events or news releases on the global economy.
Ultimately, using a combination of technical analysis and trend filtering can increase profitability by offering valuable insights into current dynamics between currencies while also being able to adjust quickly when market conditions change unexpectedly.
Strength Gauging
One of the most important steps to successfully trading currency crosses in forex is gauging their strength.
To assess this, traders often turn to technical analysis for help. Technical analysis examines prices, volume, and open interest to evaluate a cross’ short-term momentum and longer-term trend. By comparing different currency pairs, traders can quickly spot which ones are lagging or leading at any given time. This allows them to make informed decisions about when to buy or sell these particular crosses.
Traders may also use oscillators and moving averages on a single chart to judge which pair has higher bullishness or bearishness. Oscillators like Stochastic and Relative Strength Index (RSI) analyze price movements with respect to recent highs and lows while providing signals for entry and exit points based on overbought/oversold levels. Moving averages such as the Exponential Moving Average (EMA) track past prices over certain periods of time to signal possible support/resistance areas as well as trends in general market sentiment for that specific currency pair.
To get an edge in the market, it pays dividends to know exactly how much strength each individual cross holds before executing trades accordingly. The combination of technical indicators mentioned above provides traders with all the necessary information they need in order determine whether a trade setup is likely profitable or not beforehand — thereby increasing their chances of success greatly if used correctly.
Relative Volume
Technical analysis is a key component of trading currency crosses in the forex market.
One valuable metric that traders should consider when evaluating cross pairs is relative volume. Relative volume measures the size of recent activity for any given security relative to the other securities on that particular exchange, allowing traders to gauge how active a particular cross has been over time. It helps them compare different currencies, and decide which ones offer higher potential returns with lower risk.
To calculate relative volume, divide the current period’s volume by the average of prior periods’ volumes. This will give a value between 0–100; if it exceeds 70, this indicates there are more shares traded than usual. If relative volume is above 70 during an up trend then it can be taken as confirmation that prices may rise further due to increased buying pressure from investors and speculators alike.
Conversely, if it falls below 30 during a down trend then prices could continue downwards as selling pressure increases significantly from participants who want out of their positions before they incur losses.
Relative Volume gives valuable insight into market sentiment and liquidity levels in currency crosses — two vital components for successful trading strategies when dealing with Forex markets. With this information at hand, traders can better evaluate which cross-pairs to focus on or even develop new tactics based on specific trends revealed through careful monitoring of corresponding price movements alongside realitive volume indicators.
Support & Resistance
Support and resistance are key concepts in forex trading when it comes to technical analysis.
Although their names make them sound intimidating, they’re actually not as complicated as they seem. By understanding support and resistance levels, traders can better anticipate market behavior and make more informed decisions when entering or exiting trades.
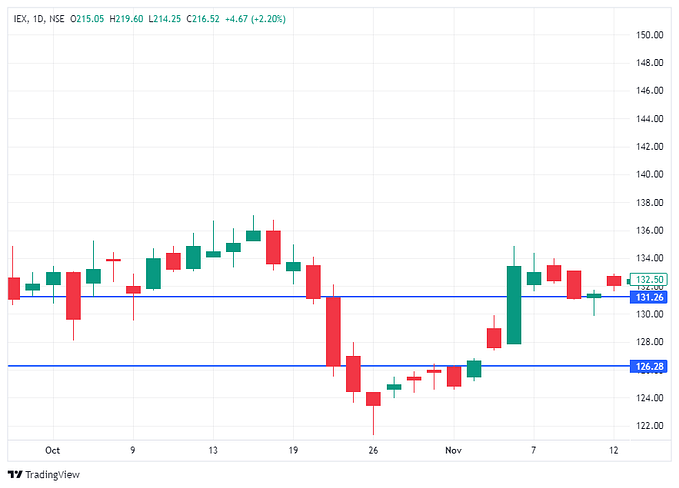
Support and resistance levels refer to areas of price where a currency is likely to experience buying interest or selling pressure. This creates a floor for prices — called support — beneath which the price will not tend to fall without an increased force pushing it down (such as bad news). Conversely, a ceiling called resistance exists above which prices will be pushed back down without an equivalent force pulling them up. In simple terms, when a currency pair reaches either its support or resistance level, it is expected to reverse course until it hits the opposite boundary again.
By recognizing these key levels on charts, traders can make informed decisions about entry and exit points that can maximize profits while reducing risk exposure. One way of doing this is by watching for breaks — if a currency pair falls through its support level with sufficient volume indicating strong buying pressure driving it down then this could indicate further downside movements making shorting the pair attractive at such times for trend following strategies.
On the other hand if a break upwards occurs above resistance then that indicates potential upside movements so going long would be recommended by some technical analysts during such situations.
Momentum Oscillators
Technical traders rely on momentum oscillators to identify the strength and timing of market trends.
Momentum oscillators, such as the Relative Strength Index (RSI) and Stochastics, are essential for providing directional information for trading currency crosses in forex markets.
RSI is a popular and widely used technical indicator that helps measure the speed of price changes in an asset over time. It does this by comparing up-moves to down-moves over a period of time, with a reading higher than 70 typically signaling that an asset may be overbought while readings lower than 30 indicate it may be oversold. Consequently, when RSI moves from above 70 or below 30 levels back toward 50 — also called neutral level — it can signal a possible trend reversal in the near term.
Stochastics is another well-known oscillator used by many traders for identifying momentum and likely reversals in prices using two lines — %K line (blue line) and %D line (red line). The %K indicates where the current closing price stands relative to range of prices during a specified number of periods while %D represents moving average of %K values usually set at 3 days. A buy signal occurs when both lines cross above 20 while sell signals are triggered when both lines move under 80 levels.
Sentiment Analysis
Sentiment analysis is an important component of technical analysis when trading currency crosses in the forex market.
This involves gauging how traders feel about a certain security, such as a cross pair, and using that information to make investment decisions. Sentiment can be based on traditional news sources or financial publications, but more often it’s derived from social media conversations or other online discussion forums. By monitoring these conversations, investors can detect strong sentiment around particular currencies and use this data to create successful strategies.
One way to leverage sentiment data is by looking for turning points in price action due to increased interest. For example, if there is suddenly heightened enthusiasm for a certain currency pair on the internet, then investor attention will turn towards the security which could result in price movement.
On the flip side, negative feelings might lead to decreased demand and lower prices overall. As such, being up-to-date with online conversation activity related to each security is paramount when applying sentiment analysis techniques in forex trading.
Sentiment analysis can also be useful when attempting to predict long term trends in the market. Investors can look for positive or negative comments concerning specific currencies over time and use this knowledge when formulating longer-term strategies.
Generally speaking, sustained interest over multiple periods suggests that investors still favor the asset despite potential volatility which may suggest further appreciation of its value over time.
Alternatively, waning investor interest could signal imminent bearishness which should be taken into consideration before opening any positions involving the asset at hand.
The Takeaway
Embark on a transformative journey in the forex realm by unlocking the power of precision through technical analysis. Gain a profound understanding of indicators, decipher price action nuances, assess strength, and harness sentiment analysis. This comprehensive guide empowers you to navigate the forex markets with confidence, providing insights into trends, support, resistance, and momentum.
Elevate your trading game, transforming uncertainty into calculated profitability. Welcome to a realm where precision meets opportunity — your gateway to mastering forex starts here!
Discover TradeDork
Unlock the secrets of trading mastery with TradeDork, where enthusiasts and experts converge to simplify the intricacies of the market.
Master the Game: Elevate your skills with our complimentary masterclass here.
Join the Hub: Connect, share insights, and ride the pulse of market trends. Dive into our vibrant Discord community here.
Embark on your trading journey with TradeDork and trade fearlessly!
Happy Trading!


